Modeling the game using Obsidian canvas
In this article I will show how we at tezee.art studio use infinite Obsidian canvas in development. And that the canvases are suitable not only for documenting something but also for modeling. That is the resulting graph-document is used as a schema for further interpretation in code (this approach is known as Schema Source of Truth).
Why Obsidian is good for this
- It's free and it's a good IDE for text. Even without extensions and plugins.
- With Obsidian you choose how to store your documentation, for example in git. So cloud storage in Obsidian is an optional paid feature.
- It can work with markdown.
- It also has such functionality as canvas.
Content organized by cards in the form of a graph on canvas is much better in visibility than conventional long-form documentation like wiki/confluence. By documentation visibility I mean that it is informative and understandable which are indicators of quality. With quality documentation we spend less effort:
- on understanding other developers code;
- on solving problems related to bugs;
- transferring knowledge to new team members.
Vanilla Obsidian already provides comfortable work without requiring additional customizations. Except that you can choose a theme: specifically I like the popular dark theme obsidian_nord, it makes it more comfortable to switch between IDE code.
Making the rules of the game clear to the whole team
Creating a game project from scratch can be challenging. The board game we chose as our debut game project doesn't look so big and complicated at first glance. But still like any system it requires clear documentation. Without proper documentation, the game's development and support can descend into chaos. That's why from the very beginning we were puzzled how to make good documentation for a game project. Specifically, how to describe the rules of the game and not get confused later.

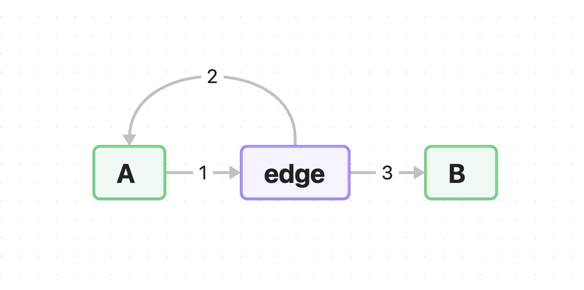
In the architecture of the board game we've laid down a simple principle: the game has finite states and transitions between them. This visually corresponds to an oriented graph (a graph with directions in the form of arrows). This is the kind of graph we can represent on canvas. We name this principle meta-edge because we use a separate node card to describe an “arrow” in the graph.
To better understand the modelling principle I will give a simple example of a scheme for a game in which we need to roll a game-defined number on a dice. Additional information about the card is optional but can be helpful. Coloring and labeling arrows is optional, but it can enhance the clarity of the scheme.

In this way we can create graphical schemes that help us understand the complex relationships between different parts of the game. That is the description of the rules of the game is a large composition of states and transitions. We just have to model the graph… but there are nuances.

The nuances arise when we need branching. Here is a simple example of branching:

As we continue to add more connections, say we want to add the transition C -edge→ B, then we also get an extra relation that we did not intend, it is C -edge→ A. Such links interfere with the correct interpretation of the scheme.

Therefore when modeling a graph it is necessary to be careful when making connections. And such situations should be solved through duplication.

In this repository you'll find more examples and the parser code we use to check the integrity of our board game rule scheme.

How it works
Canvas files are saved with the *.canvas extension but it is actually a regular JSON file that describes the CanvasData type. All types for TypeScript can be explored in the official Obsidian repository canvas.d.ts.
For the schema we'll just need a card of type CanvasTextData. And to distinguish a state card from a transition card, we simply color them in distinctive colors by convention: we color states with color 1 and color transitions with color 2. And also by convention we will name the markdown cards with # Title. These titles are easily visible during zooming and navigation of the canvas.
Next, we build a graph using the fromNode and toNode identifiers, whose information is stored in the CanvasData['edges'] property. For a convenient programmatic interface, we use the graphlib library. This is a good API for graph structures, so you don't have to invent something of your own. But you can easily replace it with something else.
What we got in the end 💎
We got a graph with a program interface through which we were able to control the development. Visualization helps to see the final set of things we need to implement.
Now we have clear documentation. We use it as a data structure for further operations on the game code. For example, we generated part of the boilerplate code through hygen.
The programmatic implementation is consistent through documentation and we are sure of it. In this way we can create complex schemas that help us understand the game logic. This is especially useful for new members who can use these schemas to find information about how the game works.
We have also gained a general concept of modeling systems that can be used regardless of language, platform, or other factors. We will continue to use canvas to model various processes because Obsidian has the flexibility to customize it.
Conclusion
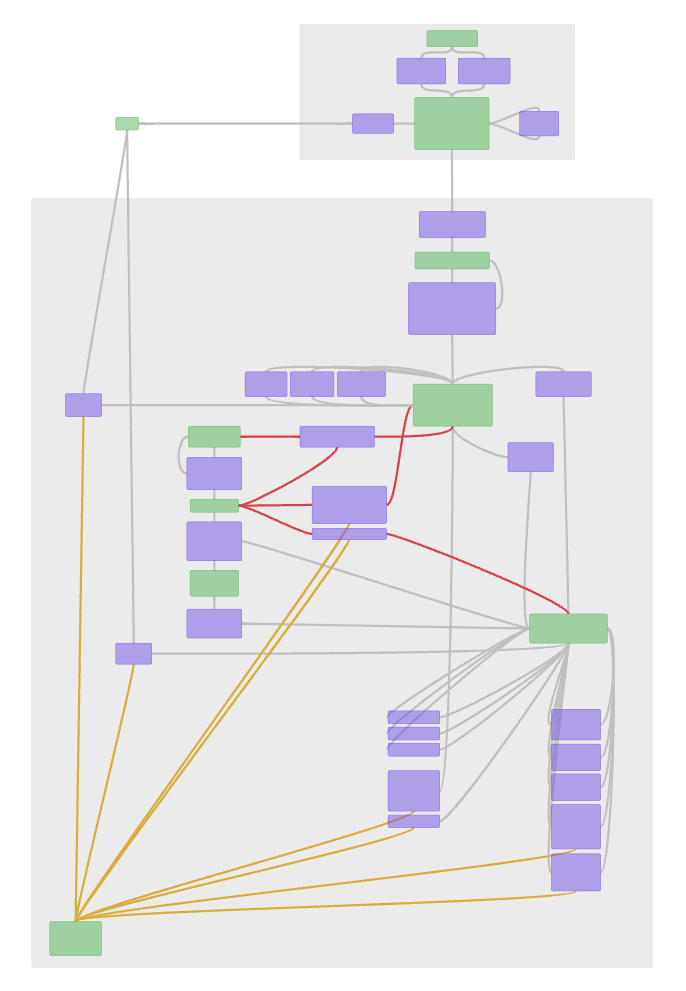
The following image shows a general view of the blocks of the schema we developed for our board game. We cannot reveal the details of the schema because they are already part of our core processes and the intellectual property of the studio. However, the overall view of the schema demonstrates the effectiveness of using schema-first design in the creation of game projects. We hope that our modeling experience will help you in creating your own games and applications.

Read also
More about schema-first design is discussed by Kristopher Sandoval in this article: Using a Schema-First Design as your Single Source of Truth
